Full bays, a higher rate, the same bank balance
Independent auto repair shop, Connecticut, September 2026.
Worth $87,601 a year, plus $26,671 for every 5 points of declined work won back.
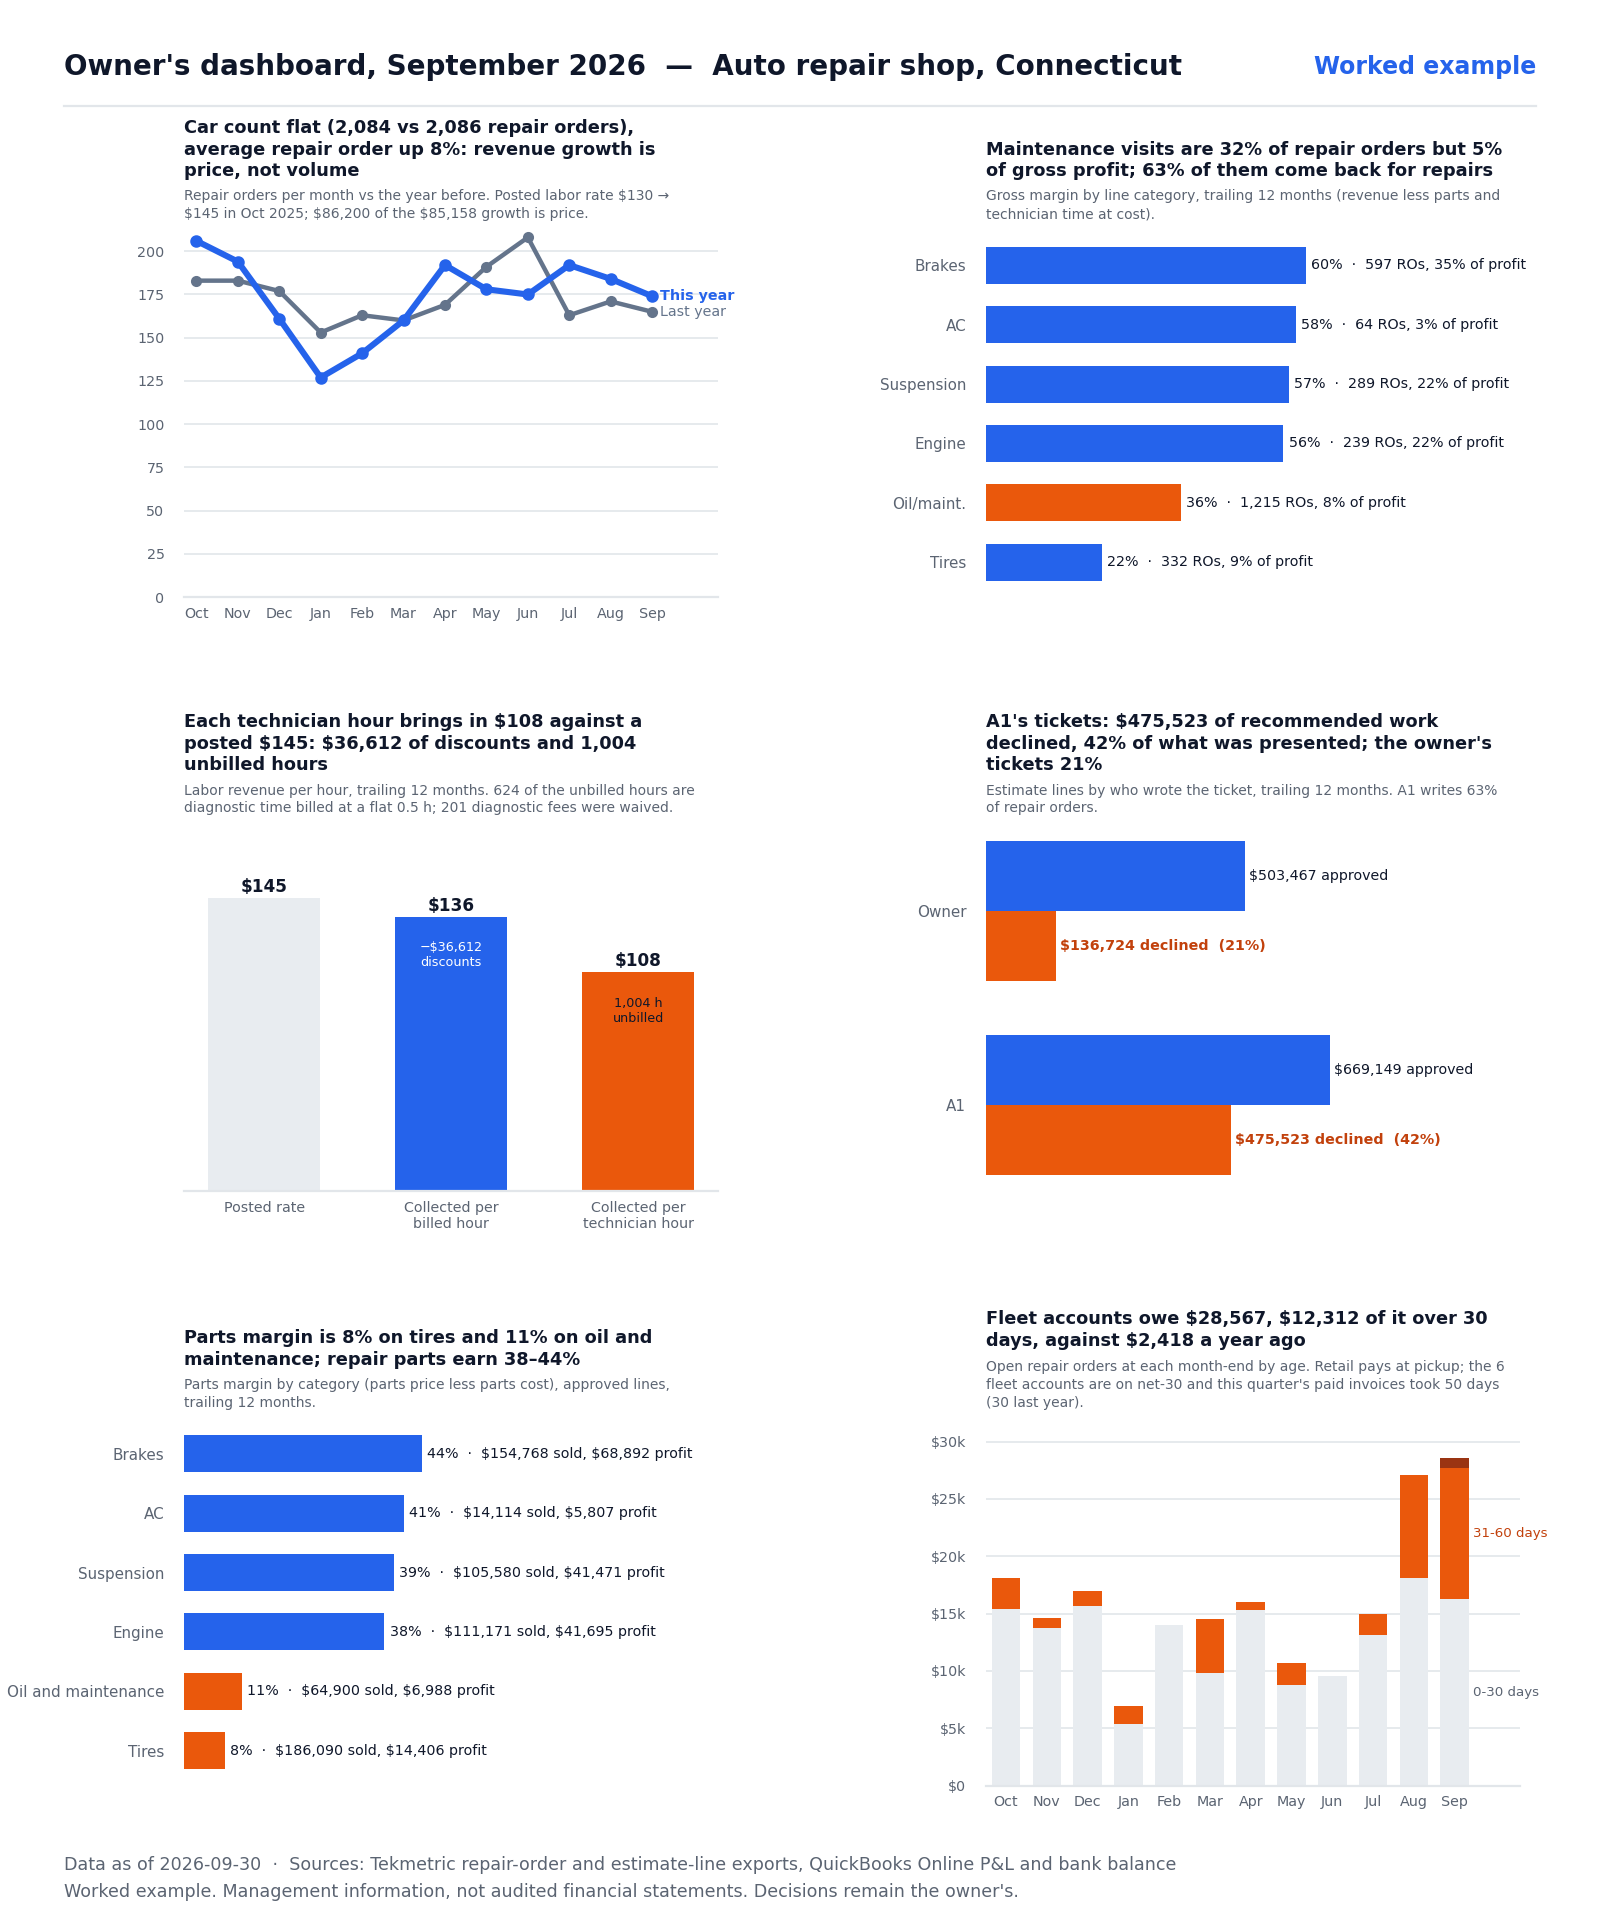
What it was worth
$87,601 a year, found in an independent repair shop doing $1.17M.
$59,087
a year in labor revenue, with no extra hours worked
Bill diagnostic time as worked, and stop waiving the fee when the repair is approved.
615 diagnostic lines billed 308 hours while technicians clocked 931. The 201 waived fees were worth $14,572.
$28,514
a year at current volume
Reprice tires to a 20% parts margin, or add a mount-and-dispose charge that gets there.
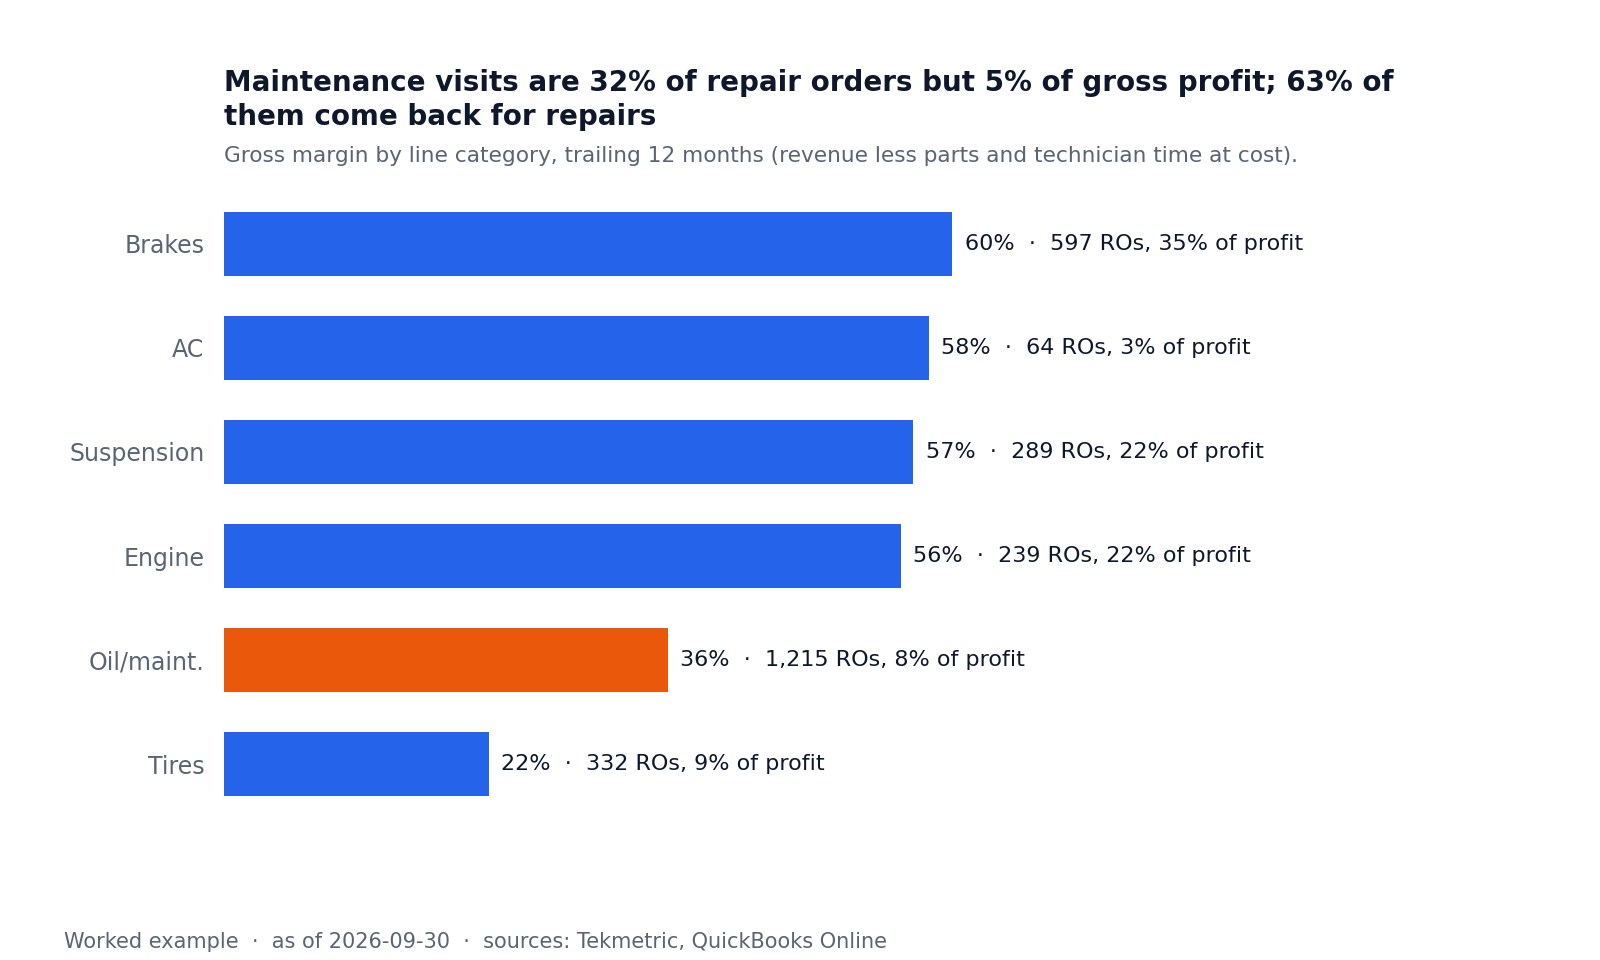
$186,090 of tires sold this year at a 7.7% margin. Brakes earn 44.5%.
$26,671
of gross profit for every 5 points off one advisor’s declined work
Sit in on A1’s estimate presentations for two weeks, and put a ranked list with photos on every estimate.
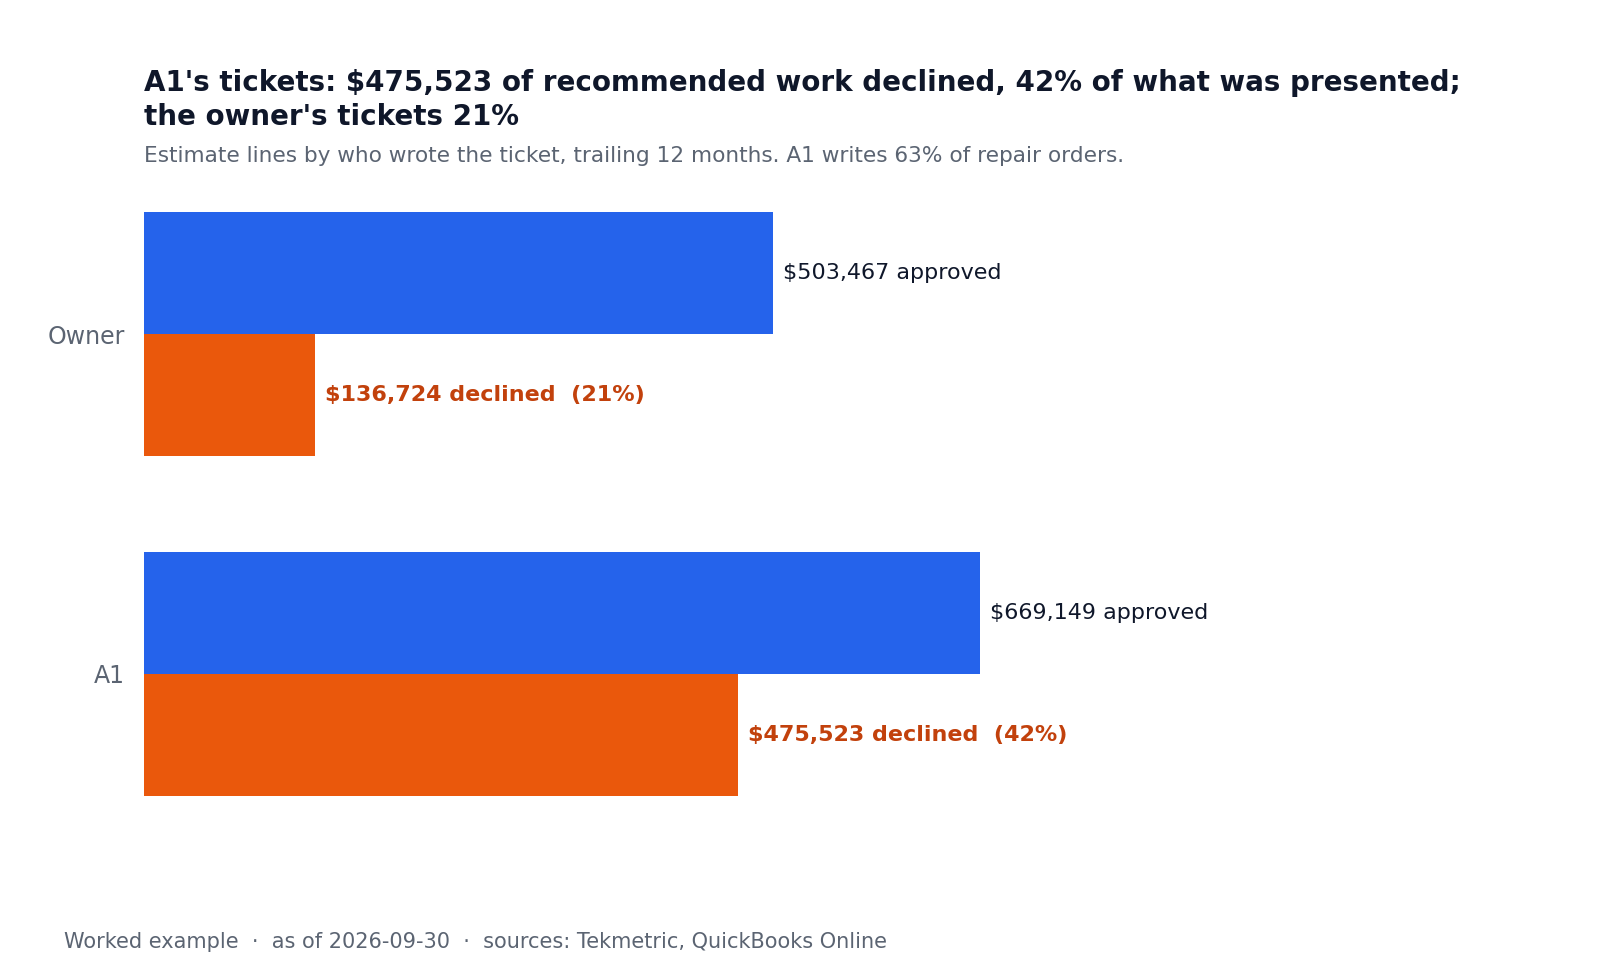
A1’s tickets had 41.5% of $1,144,671 presented declined, against 21.4% on the owner’s. Each 5 points is $57,234 of approved work.
$12,312
of cash in the next 30 days
Call the six fleet accounts this week and send statements weekly.
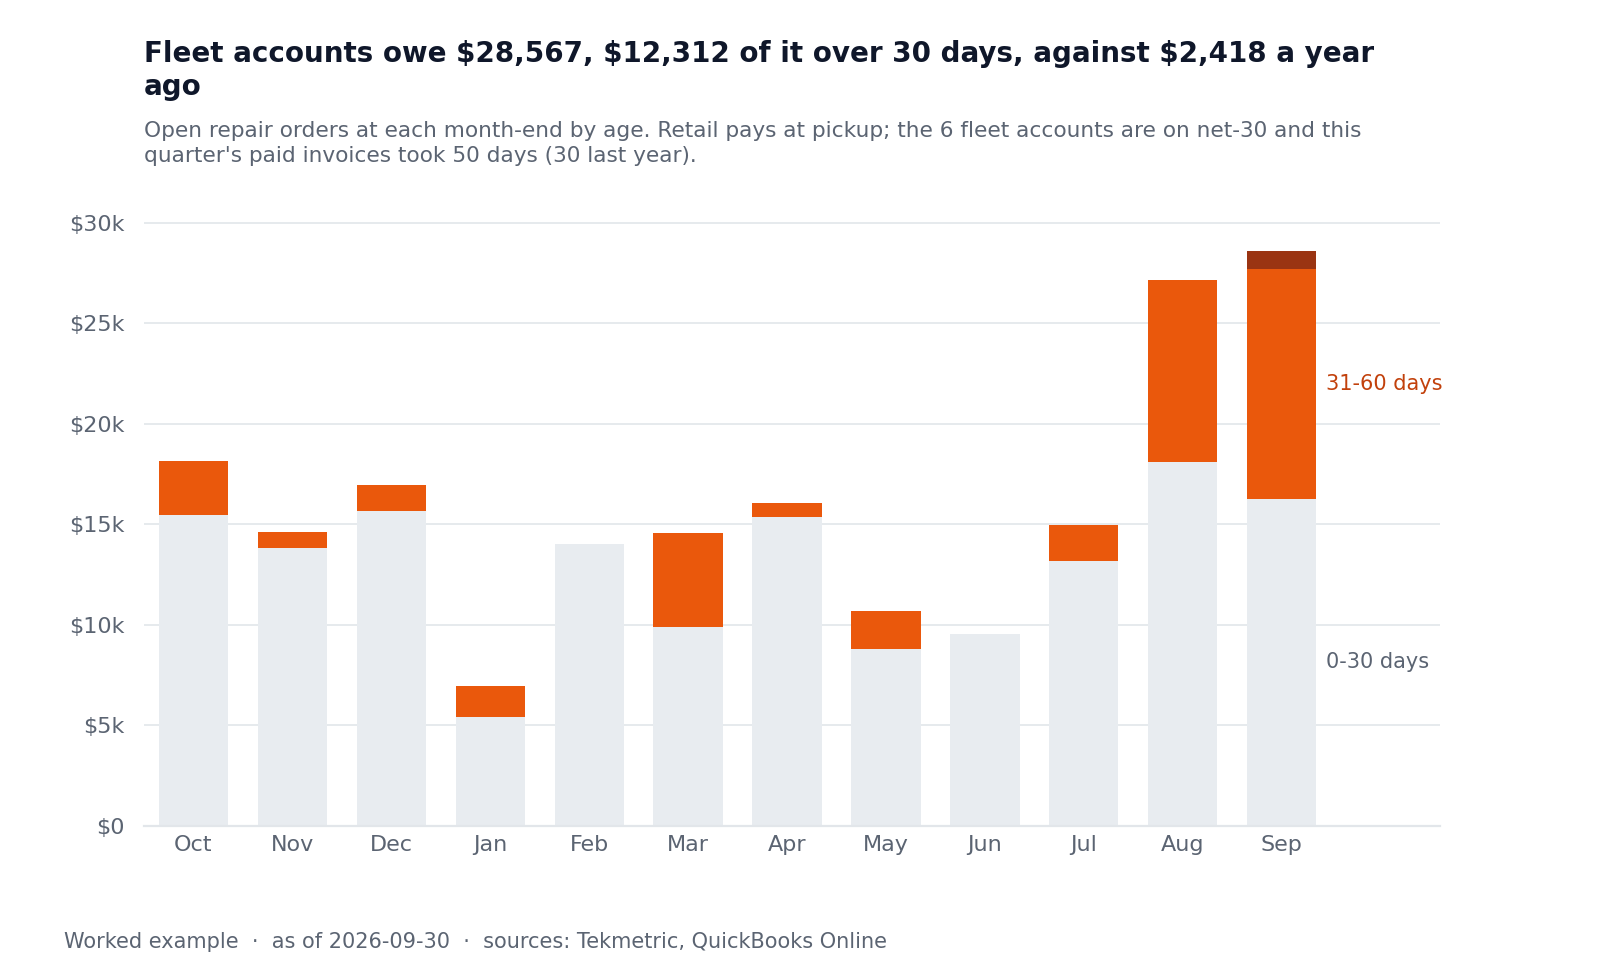
Fleet invoices paid this quarter took 50.4 days, 29.6 last year. Collected, it adds 0.6 weeks of cash cover.
“We raised the labor rate, the bays are full every day, and the bank balance looks the same as last year. What am I missing?”
What I worked from
Four exports the owner already had: Tekmetric repair orders (4,170 over 24 months) and estimate lines (9,657, 2,235 of them declined), the QuickBooks Online profit and loss by month, and the bank balance on 30 September. I reconciled them first: each repair order to its approved lines, parts in QuickBooks to parts on those lines.
Findings
2,084
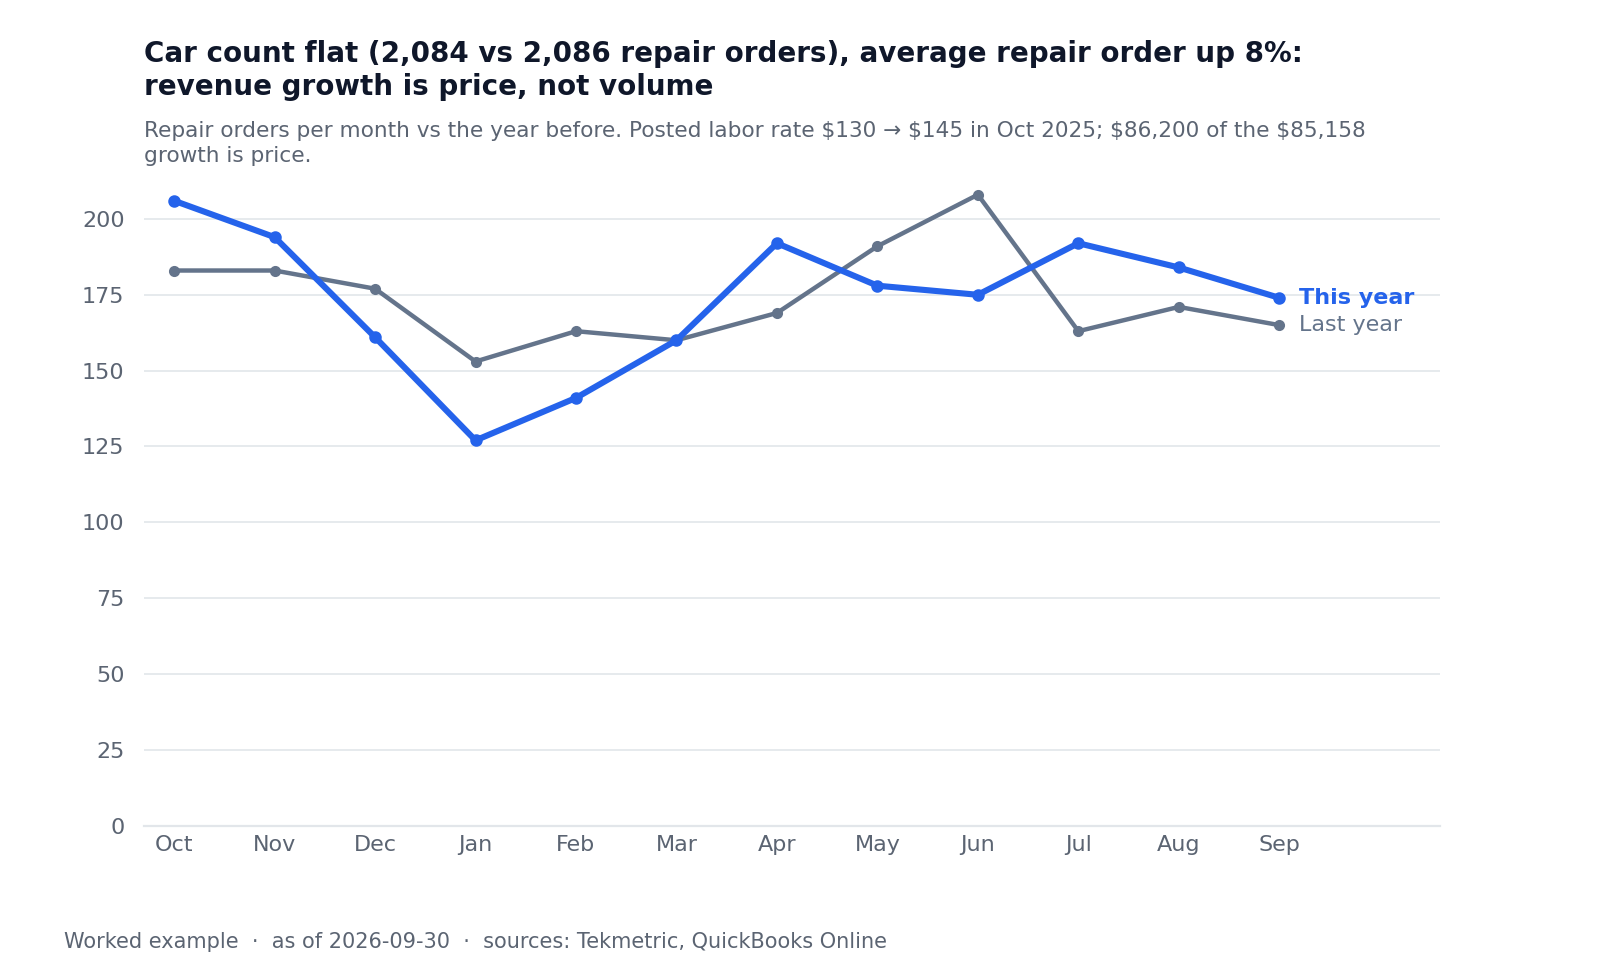
repair orders this year, against 2,086 last year
Growth is price, not cars. The average repair order rose from $521 to $563 after the posted rate went from $130 to $145, and revenue rose 7.8% to $1,172,616.
$108
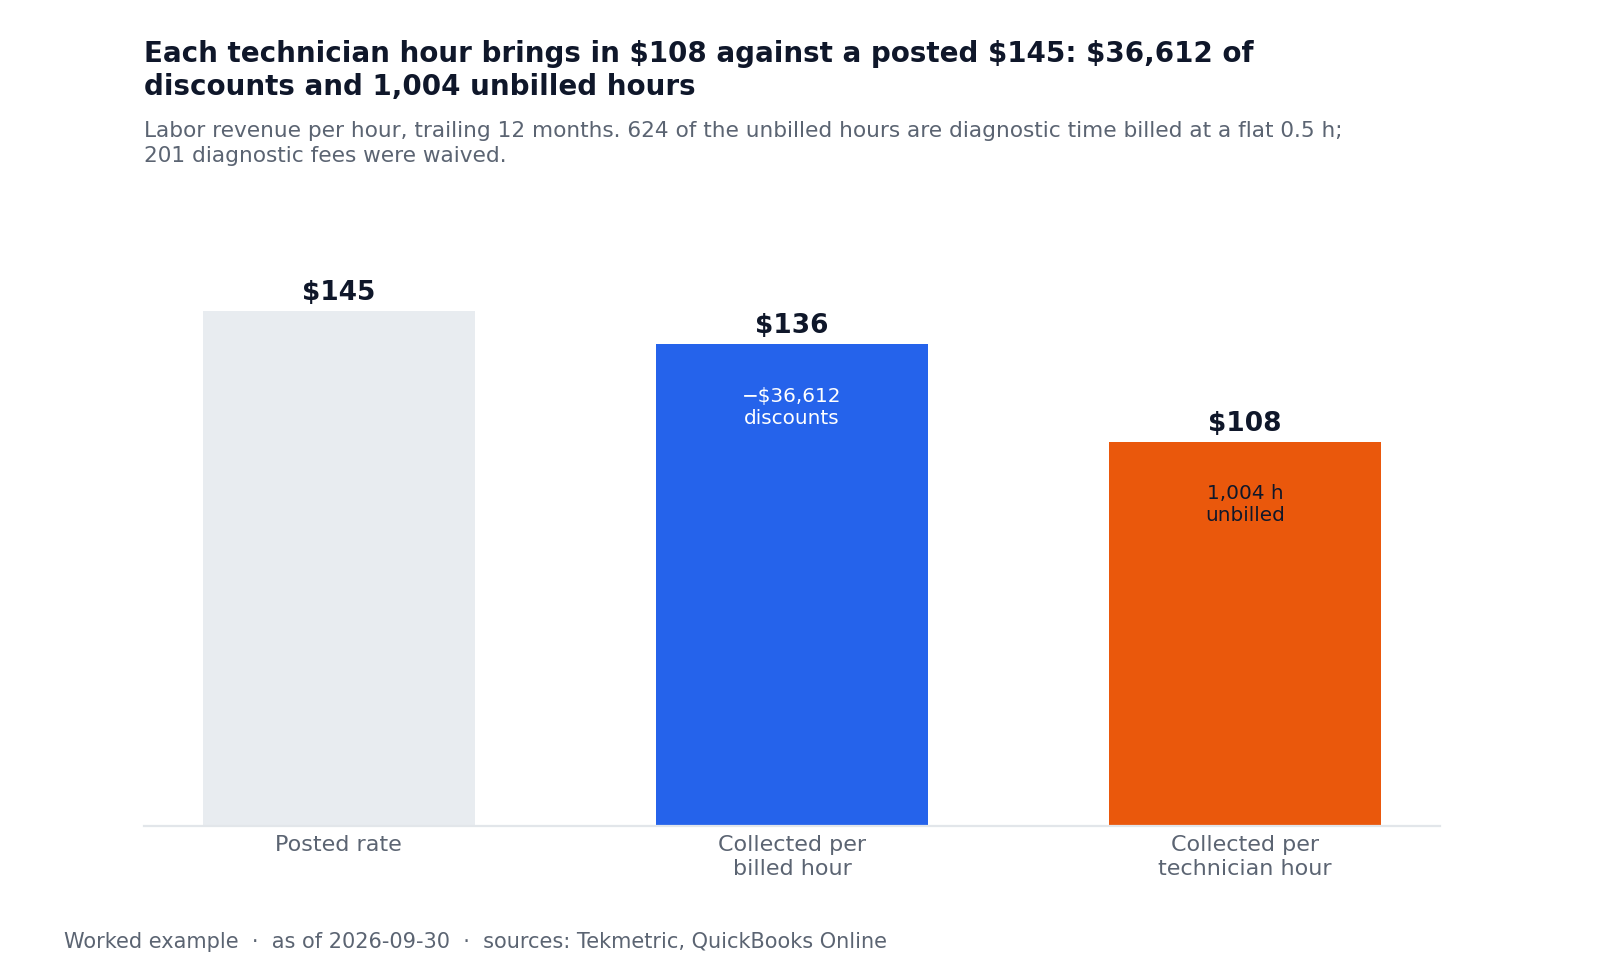
collected per technician hour, against a posted $145
The rate on the wall is not the rate collected. $136 per billed hour after $36,612 of discounts and waived diagnostic fees; $108 per technician hour, because 1,004 hours were never billed, 624 of them diagnostic time charged at a flat half hour.
7.7%
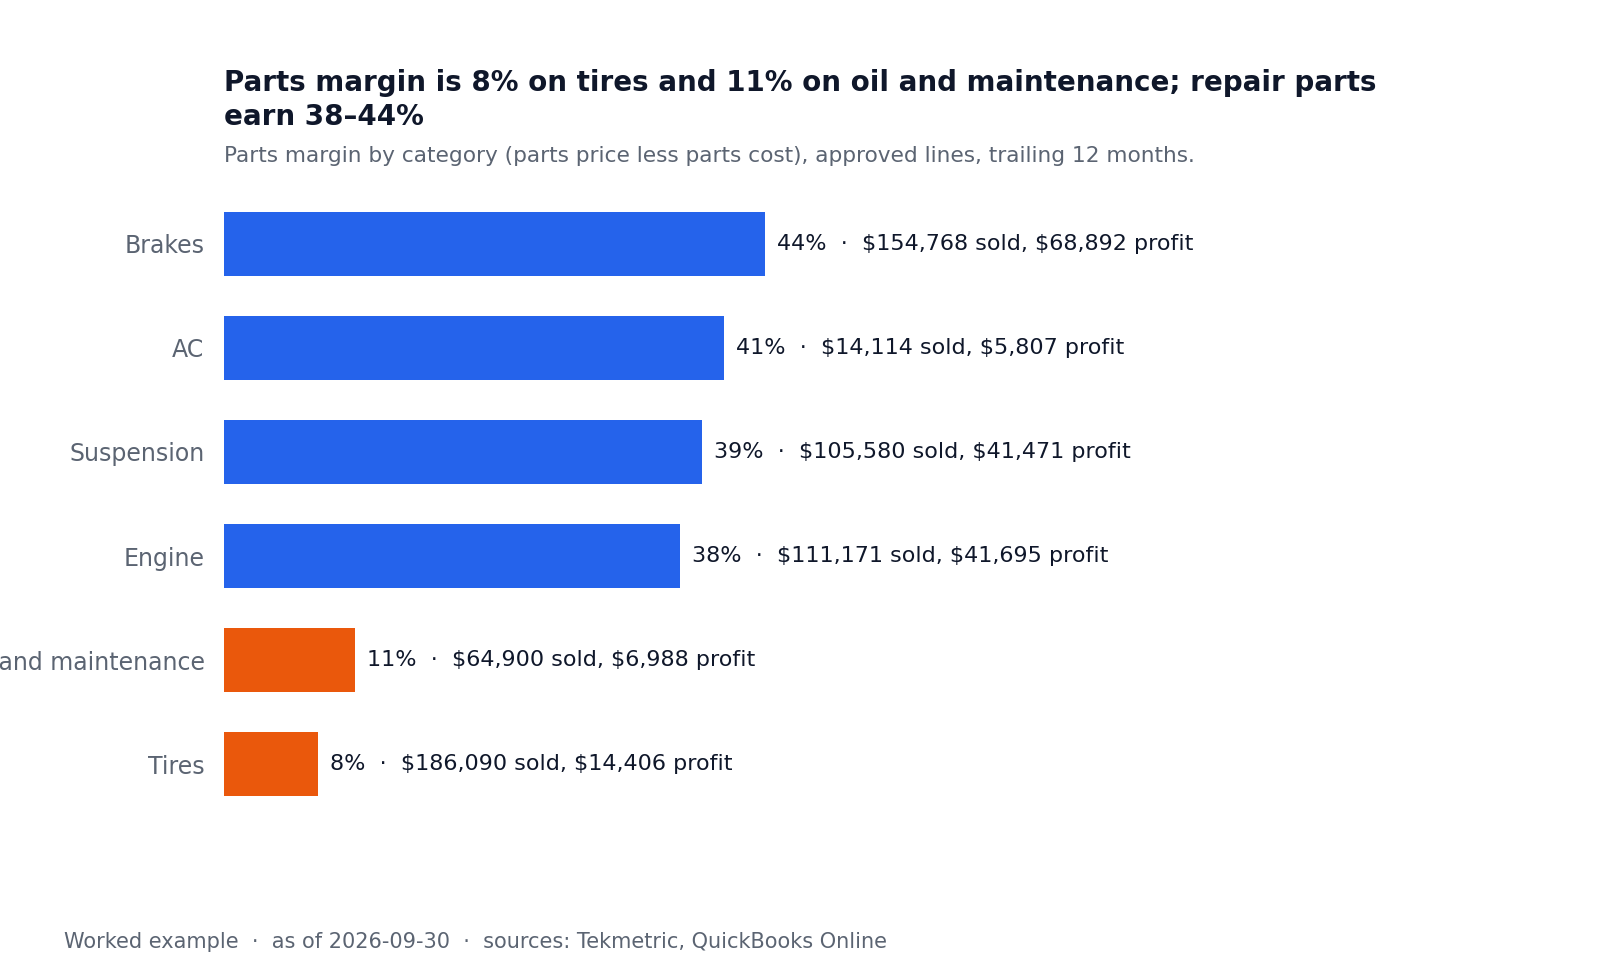
parts margin on $186,090 of tires
Tires are sold at cost. Brakes, AC, suspension and engine parts earn 37.5% to 44.5%.
$475,523
of recommended work declined on one advisor’s tickets
Declined work sits on A1’s tickets: 41.5% of what was presented, against 21.4% on the owner’s.
$12,312
owed more than 30 days, against $2,418 a year ago
Fleet accounts pay slower. Fleet invoices paid this quarter took 50.4 days, 29.6 last year. The $58,000 in the bank covers 2.8 weeks of expenses.
Also recommended
Keep the maintenance visits; put the inspection sheet on every one.
Expected effect: 665 visits earned $41 each, but 62.7% of the customers who started with one came back for repairs: $177,294 of gross profit over two years.
Caveats
Gross profit is revenue less parts and technician time at the owner’s $34 loaded rate: management information, not the accountant’s figures. The cash view ignores owner draws. Decisions remain the owner’s.
The six charts
Read the one-page Owner's Report
Owner’s Report — September 2026
Independent auto repair shop, Connecticut · Worked example · Prepared by Abraham Dunn · Data as of 2026-09-30 Sources: Tekmetric repair-order and estimate-line exports, QuickBooks Online P&L by month and bank balance.
Verdict: WATCH — revenue is up on price alone; labor, tires and declined work leak profit.
| Sep 2026 | Aug 2026 | Sep 2025 | Trailing 12 months | |
|---|---|---|---|---|
| Revenue | $98,242 | $100,014 | $80,444 | $1,172,616 |
| Gross profit | $44,893 | $45,981 | $36,620 | $546,850 |
| Gross margin | 45.7% | 46.0% | 45.5% | 46.6% |
| Net profit | $7,811 | $9,380 | −$1,881 | $94,991 |
| Repair orders | 174 | 184 | 165 | 2,084 |
| Average repair order | $565 | $544 | $488 | $563 |
| Estimate approval rate | 63.8% | 61.9% | 58.5% | 65.7% |
| Owed more than 30 days | $12,312 | $9,036 | $2,418 | $3,062 (12-month average) |
What happened
September was a solid month: revenue of $98,242 against $80,444 last September, and a net profit of $7,811 where last year lost $1,881. The year tells a different story. Revenue reached $1,172,616, up 7.8%, on 2,084 repair orders against 2,086 the year before: all of the growth came from the average repair order rising from $521 to $563 after the labor rate went to $145. Four things leak profit under that growth. Each technician hour brought in $108 against the posted $145: $36,612 went in discounts and waived diagnostic fees, and 1,004 technician hours were never billed, 624 of them diagnostic time charged at a flat half hour. Tires earned a 7.7% parts margin on $186,090 sold; brakes earned 44.5%. A1’s tickets had $475,523 of recommended work declined, 41.5% of what was presented, against 21.4% on yours. And the six fleet accounts owe $28,567, $12,312 of it over 30 days, against $2,418 a year ago. Cash of $58,000 covers 2.8 weeks of expenses; the fall usually rebuilds it.
Actions
- Bill diagnostic time as worked, and stop waiving the fee when the repair is approved. 615 diagnostic lines were billed 308 hours while technicians clocked 931. Billing one hour on each line is 307 more hours, $44,515 at $145; the 201 waived fees were worth $14,572. Expected effect: up to $59,087 a year in labor revenue, with no extra hours worked.
- Reprice tires to a 20% parts margin, or add a mount-and-dispose charge that gets there. $186,090 of tires sold this year cost $171,683, a 7.7% margin. At 20% the same tires bring in $214,604. Expected effect: $28,514 a year at current volume.
- Sit in on A1’s estimate presentations for two weeks, and put a ranked now / soon / later list with photos on every estimate. A1’s tickets had 41.5% of $1,144,671 presented declined; yours 21.4%. Expected effect: every 5 points off A1’s declined share is $57,234 of approved work, about $26,671 of gross profit at this year’s 46.6% margin.
Watch list
- Discounts. 735 discounted lines this year, $22,039 off repair labor, $36,612 in total with waived diagnostics. Anything over 10% should need your initials.
- Fleet receivables. $28,567 open, $12,312 over 30 days; this quarter’s paid fleet invoices took 50.4 days against 29.6 last year. Call all six accounts this week and send statements weekly. Collecting the $12,312 takes the bank balance to $70,312, 0.6 weeks of cover.
- Maintenance visits. 665 visits, 31.9% of repair orders, earned $27,186 of gross profit, 5.0% of the total, $41 each. Keep them: 62.7% of the customers who started with one came back for repairs, $177,294 of repair profit over two years. Put the inspection sheet on every one; that is where the declined work starts.
- Cash. $58,000 covers 2.8 weeks of expenses ($20,724 a week). The 13-week view clears the 4-week line ($82,894) in week 2 and reaches $138,708 by week 13 on last year’s fall volume.
- Customer concentration. Top 10 customers are 15.5% of revenue across 1,095 customers; the six fleet accounts are 13.8% of revenue and all of the money owed.
Worked example. Management information, not audited financial statements. Decisions remain the owner’s.
See services or email Abe at abe@abrahamdunn.com